Fall Semester, 1999
Class Meetings: T-Th 9:30-10:45,
Phillips 265
Class Waiting List: Contact Ms. Lois M. Douglass
Office: New West 112
Phone: 962-2307
Email: lmd@stat.unc.edu
Instructor: J.S.
Marron, Professor
Email: marron@stat.unc.edu
Office: New West 304
Phone:
Office: 962-2188
Home: 493-2844
FAX: 962-1279
Office Hours:
Always: Thursday 11:00 -
12:30, 1:30-3:30
Usually: Monday 10:00
- 12:00, 1:30 - 3:30
Tuesday 1:30 - 3:00
Possibly: other
times
Teaching Assistant: Ms. Xiaohui Wang
Email: xwang@email.unc.edu
Office: Smith 105
Phone: 962-3992
Office Hours:
Wednesday 1:00-5:00
Grading: Based on:
1. Homework 10%
2. Midterm I
20%
3. Midterm II
20%
4. Final Exam (cumulative) 50%
Homework: Assigned daily, collection for each week is due Thursday of the following week, at the beginning of class. No late homework accepted, lowest two scores dropped.
Dates of examinations:
Midterm I: Tuesday, September 21.
Midterm II: Tuesday, November 9.
Final: Tuesday, Dec. 14, 8:00AM.
Textbooks:
McClave, J. T., Benson, P. G. and Sincich,
T. (1998) Statistics for Business and Economics, 7th edition, Prentice
Hall.
This is the main textbook. It will be referred to as a source
for Homework Exercises, and additional reading.
Dummeldinger, M. (1998) The
Microsoft EXCEL Supplement for Statistics for Business and Economics,
Prentice Hall.
This provides help with the computational side of the course.
Approximate Ordering of Material
Chapter and Section Numbers from McClave, Benson and Sincich (1998)
Statistics
for Business and Economics, 7th Edition.
In the format: Chapter.Section
1.1, 1.2, 1.3, 1.5, 1.6, 1.7
3.1, 3.2, 3.7, 3.3, 3.4, 3.5, 18.9, 3.6
4.1, 4.2, 4.4
2.2, 4.3, 2.4, 2.5, 2.6, 2.8
5.1, 5.3, 2.7, 5.4
6.1, 6.3
7.1, 7.2, 7.3, 7.4, 7.5
8.1, 8.2, 8.3, 8.4, 8.5
9.1, 9.2, 9.3, 18.6
Internet and Email access:
+ These are essential for this course.
+ Class ListServ:
Name of the list: Stat23-1
(caution:
you need to remember this when you get to the
ListServ page. You must enter it on the third line of their
menu to get added to our list. Note that there are 8 characters,
with no spaces, and the symbol after 3 is a "dash")
To subscribe go here.
(class announcements and updates, such as canceled classes
and discovered errors on homework problems, will come
to you by email when you subscribe to this).
To check that you are on, go here
for a text file with the full list (last updated 9/2/99)
+ The data sets used in the text book are internet available:
From the publisher: http://www.prenhall.com/mcclave/statsbe/html/tsdata_index.html
Locally at UNC (in Excel spreadsheet
form): http://www.unc.edu/depts/statistics/postscript/papers/marron/stat23/TextBookData
Computation:
+ Done with Microsoft EXCEL97.
+ You can use any computer of your choice, that has EXCEL, or use those available in the ATN Computer Labs, go here for lab locations and schedules.
+ EXCEL is "user friendly", so if you have experience using computers, you may be able to just start using EXCEL.
+ If there are some specifics about which you are wondering "how do I do that?", the first section of the Dummeldinger (1998) text above provides well organized access to a number of important topics.
+ If you don't have prior computing experience, then a careful
reading of Section P, at the beginning of the Dummeldinger (1998) text
is recommended.
Additional Tips on using Microsoft EXCEL97:
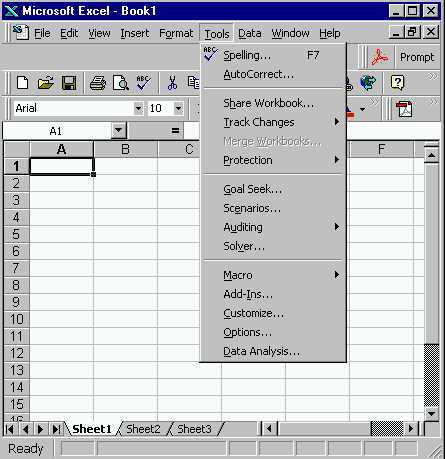
+ On many machines, including those in the ATN Labs, many of the statistical analysis tools we will use require loading the "Analysis ToolPak".
+ You can see if this available, by starting EXCEL, then clicking on "Tools" on the toolbar at the top. If the Analysis ToolPak is loaded, your screen should look like:
If the last option, called "Data Analysis..." is there, then the Analysis ToolPak is loaded, and you can follow instructions as in the Dummeldinger textbook.
+ If the Analysis ToolPak is not loaded, you should be able to load it by going to the "Add-Ins..." Option on the above menu. This will pull up a window that looks something like:
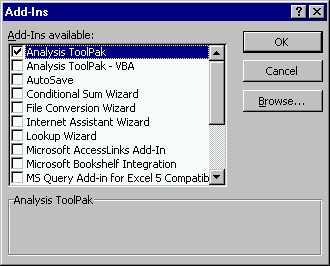
Click in the box for "Analysis ToolPak", so the screen looks like the above, and choose "OK". Then "Data Analysis..." will show on the "Tools" menu as shown above.
+ If you always use the same machine, then you should only need
to load the Analysis ToolPak once. However, when you go to a different
machine at the ATN Labs, it is likely that you will need to load it on
that machine (at least at the beginning of the semester!).
Course Handouts and Graphics:
1. Initial Handout (mostly about getting to the Internet): Microsoft Word Version PDF Version
2. Homework Assignment #1, due 8/26/99
(final): Microsoft
Word Version PDF
Version
(Hint:
for suggestions on using EXCEL to generate "random" numbers, go here)
3. Class Example 1, work out textbook problem 3.11, using Excel: Web version of example shown in class, Excel spreadsheet itself.
4. Homework Assignment #2, due 9/2/99 (final): Microsoft Word Version PDF Version
5. Class Example 2, work out textbook problem 3.24, using Excel: Excel Spreadsheet.
6. Homework Assignment #3, due 9/9/99 (final): Microsoft Word Version PDF Version
7. Class Example 3, Binomial probabilities, using Excel: Web version of example shown in class, Excel spreadsheet itself.
8. Homework Assignment #4, due 9/16/99 (final): Microsoft Word Version PDF Version
9. Correct data spreadsheet, for textbooks problem 3.42 The table published in the book had the row and column totals wrong. For the Homework, please use the number in the body of the table, and compute row and column totals yourself. Excel Spreadsheet
10. Class Example 4, Bar graphs of counts, using Excel: Web version of example shown in class, Excel spreadsheet itself.
11. Class Example 5, Plots of Binomial Probabilities, using Excel: Excel Spreadsheet.
13. Class Example 6, Histogram analysis of incomes data, using Excel: Web version of example shown in class, Excel spreadsheet itself.
14. Solutions to even numbers (since odd numbers are in the Solution Book) forHomework Assignment #4: Microsoft Word Version PDF Version
15. Practice Excel Problems, for the midterm. These show you how I will formulate this type of problem. Microsoft Word Version PDF Version Excel spreadsheet with answers.
16. Midterm I: Microsoft Word Version PDF Version
17. Solution to Midterm I (updated 9/23/99): Microsoft Word Version PDF Version
18. Class Example 7, solution to text book problem 4.29a, expected value of a discrete distribution, using Excel: Excel Spreadsheet.
19. Scores on Midterm I Excel Spreadsheet.
20. Homework Assignment #5, due 9/30/99 (final): Microsoft Word Version PDF Version
21. Class Example 8, Example of median of Binomial Distribution, using Excel: Web version of example shown in class, Excel spreadsheet itself.
22. Homework Assignment #6, due 10/7/99 (final): Microsoft Word Version PDF Version
23. Notes for Excel Computer Demo, by TA, 10/1/99, 4:00, Room 212 New West.
24. Class Example 9, Analysis of Male-Female data, from HW 1, using Excel: Excel Spreadsheet.
25. Class Example 10, Numerical instability of Excel: Excel Spreadsheet.
26. Web page with Jeff Simonoff's example about numerical instabilities of Excel: http://www.stern.nyu.edu/~jsimonof/classes/1305/pdf/excelreg.pdf Some additional nice Stat 23 related stuff from Simonoff: http://www.stern.nyu.edu/~jsimonof/classes/1305/pdf/
27. Homework Assignment #7, due 10/21/99 (final): Microsoft Word Version PDF Version
28. Class Example 11, Calculation of Normal probabilities, using Excel: Web version of example shown in class, Excel spreadsheet itself.
29. Class Example 12, Normal Approximation to Binomial: Excel Spreadsheet.
30. Homework Assignment #8, due 10/28/99 (final): Microsoft Word Version PDF Version
31. Class Example 13, Central Limit Theorem: Excel Spreadsheet.
32. Homework Assignment #9, due 11/4/99 (final): Microsoft Word Version PDF Version
33. Class Example 14, t distribution, and calculation of probabilities, using Excel: Web version of example shown in class, Excel spreadsheet itself.
34. Class Example 15, solution to text book problem 7.26, expected value of a discrete distribution, using Excel: Excel Spreadsheet.
35. Class Example 16, solution to text book problem 7.40, expected value of a discrete distribution, using Excel: Excel Spreadsheet.
36. Practice Excel Problems, for the second midterm. These show you how I will formulate this type of problem. Microsoft Word Version PDF Version Excel spreadsheet with answers.
37. Homework Assignment #10, due 11/11/99 (final): Microsoft Word Version PDF Version
38. Class Example 17, Further analysis of Male-Female data, from HW 1, using Excel: Excel Spreadsheet.
39. Class Example 18, solution to text book problem 7.62, expected value of a discrete distribution, using Excel: Excel Spreadsheet.
40. Midterm II: Microsoft Word Version PDF Version
41. Solution to Midterm II: Microsoft Word Version PDF Version
42. Homework Assignment #11, due 11/18/99 (final): Microsoft Word Version PDF Version
43. Example of bad normal random number generation by Excel: Excel Spreadsheet
44. Class Example 19, solution to text book problem 7.62, using Excel: Excel Spreadsheet.
45. Homework Assignment #12, due 11/30/99 (final): Microsoft Word Version PDF Version
46. Class Example 20, solution to text book problem 8.19, using Excel: Excel Spreadsheet.
47. Class Example 21, solution to text book problem 8.46, using Excel: Excel Spreadsheet.
48. Class Example 22: Excel Spreadsheet.
49. Homework Assignment #13, due 12/2/99 (final): Microsoft Word Version PDF Version
50. Class Example 23: Excel Spreadsheet.
51. Homework Assignment #14, due 12/7/99 (optional): Microsoft Word Version PDF Version
52. Analysis of Pepsi Challenge: Excel Spreadsheet.
53. Final Exam: Microsoft Word Version PDF Version
54. Solution to Final Exam: Microsoft
Word Version PDF
Version
Posting of Recorded Grades (final version, postted
12/15/99):
Excel
Spreadsheet
If you have suggestions for improving this page, please send email to
marron@stat.unc.edu.
Back to Marron's
Home Page