Complete discussion, with full details, of this data analysis can be
found in the paper "Motion Picture Analysis of Smoothing", by N. Locantore,
J. S. Marron, D. G. Simpson, N. Tripoli, J. T. Zhang and K. Cohen (1999),
with discussion in the journal Test.,
8,
1-65. ( PDF
version (3.42 MB) / ( Postscript
Version (14.8 MB) ).
2a. Background:
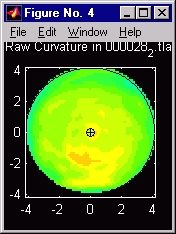
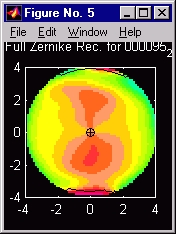
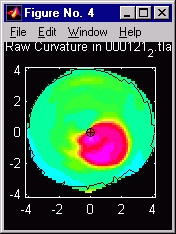
These images represent radial curvature of the surface of corneas (outer
surfaces of eyes). This shape is important, since about 85% of the
refraction done by the human eye happens here. A "temperature type" color
scale is used, with hotter colors for more curvature, cooler colors in
flatter regions.
Here are a few such images:
A cornea with fairly constant local curvature:
Strong Astigmatism (vertical ridge):
Kerataconus (an unpleasant disease, that your usual optometric corrections
can't handle very well):
2b: Population Viewpoint:
Now consider a collection of such images. How can we understand
the structure of the population. A feeling for the difficulty of
this problem comes from putting them one after the other as frames in this
movie
. Do you feel the information overload?
2c: Standard Principal Component Analysis:
Functional Data Analysis ideas, see Ramsay and Silverman (1997) Function
Data Analysis, suggests using PCA (here applied to Zernike basis fit
summarizations of the images). An problem not addressed there is
how to visualize the results (1-d methods such as overlays of projections
don't work for 2-d images). The solution is movies:
PC1:
Overall Curvature + Strength of Astigmatism
PC2:
Steeper on the top vs. the bottom (Note the strong
outlier effect!)
PC3:
With the Rule, vs. Against the Rule Astigmatism (most stigmatism
is vertical, but not all)
PC4:
???
2d: Robust Principal Component Analysis:
The above movies show important features of the population, but a major
worry is the influence of the outliers on the PC directions. As you
might expect from the movie
from Part 2b above, deletion of outliers is ineffective, because there
are too many of them. I.e. when one gets deleted, another comes in.
I tried up to 4, then quite because that is 10% of the total data set.
This motivates a "robust resistant" approach to PCA. The "directional
search methods" available in the literature do not appear useful because
of the high dimensionality, d=66. Most robust estimates of
the design matrix were not helpful, as they require 66=d<n=43.
So, we invented our own approach called "elliptical", see the paper for
details. Here are the improved versions of the above movies:
PC1:
Overall Curvature + Strength of Astigmatism
PC2:
Steeper on the top vs. the bottom (Note the disappearance
of the outlier effect!)
PC3:
With the Rule, vs. Against the Rule Astigmatism
PC4:
??? (perhaps this is a third axis of the astigmatism?)
These movies were generated using "Cornean", a CORNEal curvature ANalysis
software package written in Matlab. For more about this, inquire
by email from marron@stat.unc.edu.
Back to Movies Table of Contents
Back to Marron's Home Page