Class Notes 10/24/01
Last Time:
For new HTTP Response Size data:
- Studied Asymptotic Indepence
- Hill Estimation of tail indices
- Used for "power renormalization"
- Considered Box-Cox family of power transformations
- Explored "ratio Hill estimation"
-
log-log CCDF Tail Index Estimation
New HTTP Response Data
Data sources: 4 hour blocks of packet headers
"Morning": 8:00-12:00
"Afternoon": 13:00-17:00
"Evening": 19:30-23:30
Gathered at UNC Main Link
During 7 days in April 2001
Asymptotic Independence
Previous View: "Axis-hugging"
-
Best View: tail index transformed graphic
Another View:
- For data "in tails",
- Project to (e.g.) "unit circle"
-
I.e. study distribution of "angles" (between ![]() and
and ![]() )
)
-
Look for "pile up at end points"
Asymptotic Independence (cont.)
Angle Plot:
- 1st try was very disappointing (so not shown)
-
Everything was near ![]() (of the order
(of the order ![]() )
)
- Reason: Scales not commensurate
- Refer to Scatterplot above
-
Response Sizes were of the order ![]() (bytes)
(bytes)
-
Duration Times were of the order ![]() (sec)
(sec)
-
Implies ![]() distance heavily weighted towards Sizes
distance heavily weighted towards Sizes
Asymptotic Independence (cont.)
Improved Angle Plot:
- Control for scale
- By dividing by marginal medians
- Since robust measure of "scale" for Pareto
-
Note only "change axis labels" in previous scatterplot
Resulting SiZer analysis graphic
- Find "axis hugging"?
-
Spikes are "lines of constant transmission rate"?
Asymptotic Independence (cont.)
Interesting variation:
Also study relationship between Size, Time
and "Rate" = Size/Time
Tail behavior of Rate? Hill Plot
- Quite often smaller tail index than either Size or Time
-
Often have ![]() less than 1
less than 1
- Implications?
-
Will use anyway in Asy. Indep. Analysis
Asymptotic Independence (cont.)
Expectations:
Time vs. Rate: Dependent
- Since big flows will feel either more or less packet loss
- Thus Time and Rate should be proportionally affected
-
Since Rate = Size
/ Time
Rate vs. Size: Independent
- Since Rate driven by packet loss
-
But Size does not appear connected to Time
Asymptotic Independence (cont.)
Results:
Time vs. Rate: Angle Plots
- Independent!?!? (recall expected dependent)
- Suggests above intuition is wrong?
- Does method seem OK here???
-
Hopefully not programming error.....
Rate vs. Size: Angle Plots
- Dependent!?!? (recall expected independent)
- Why should this be reversed???
- Expect either both dep. or both indep.???
-
Need to rethink ratio??
New Response Size Q-Q Plots (revisited)
Another view of New Response Size Data:
Extreme Value Tail Index ![]()
Recall Intuition:
-
Shape parameter of Pareto (polynomial power)
- Strong relation to Long Range Dependence
- in Mice and Elephants plots (graphic)
- ![]() in Duration Distributions,
in Duration Distributions,
implies Classical LRD in aggregated time series
- Strong relation to moments:
- for ![]() have infinite mean
have infinite mean
- for ![]() have finite mean but infinite variance
have finite mean but infinite variance
- for ![]() both mean and variance are finite
both mean and variance are finite
- similar for larger ![]() and higher moments
and higher moments
New Response Size Q-Q Plots (cont.)
Simple, straightforward Estimation
of ![]() :
:
Slope of CCDF (i.e. 1 - CDF) on log - log scale
Log-log CCDF: graphic
- All 21 time blocks appear as thin blue lines
- Each Individual labeled and highlighted in thick red
- Not very "linear"?
- Suggests classical extreme value theory
hasn't "kicked in" yet???
- Note "shapes" of curves surprisingly constant
- Suggests curvature is not "random phenomenon"!
- Instead something systematic about internet traffic?
- Point worth deeper statistical confirmation??
- Suggests enhancement of current mathematics????
- Friday evening an "extreme point"? (least steep?)
- Many Resp. Sizes near 400 bytes???
(also for Friday, Afternoon, no where else?)
- Worth plotting data between 0.999 quantile and max???
(1,000 to 7,000 of these for each time block....)
New Response Size Q-Q Plots (cont.)
Now estimate "tail index" ![]() ,
by studying:
,
by studying:
Slopes: graphic
- Simply use difference quotients from log-log CCDF
- Numerical problem: 0 denominators
- Reset to bottom of plot
- Suggest ignoring those
- Could use fancier differentiation (e.g. over bigger range)
- But this "raw data" shows interesting structure
-
"Almost always" have ![]() (interesting for LRD)
(interesting for LRD)
-
But no apparent "tail limit" for ![]() ?
?
- So do not satisfy "classical heavy tail definition"?
- But still clearly "intuitively heavy tailed"?
-
Worth exploring alternate definitions?
New Mathematics for "Heavy Tails"?
Version 1:
For some ![]() ,
,

Open Problem 1: For the simple Model,
with Version 1 tailed Duration Dist'n, is
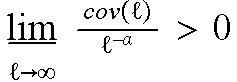 ?
?
(i.e. have index ![]() LRD)
LRD)
Version 2: Reformulate, in terms of: have

Open Problem 2: For the simple model,
with Version 2 tailed Duration Dist'n,
can we still have 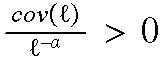 (in a suitable sense)?
How do we modify version
2 to make this happen?
Is "Long Range Dependence" Real?
Stegeman, A. W. (2001) "Non-stationarity
versus long-range
dependence in computer network
traffic measurements", unpublished. Maybe available at A.W.Stegeman@math.rug.nl???
Main Idea: analyzed several famous data sets,
suggests that ARIMA(p,1,q) fits better
- Recall ARIMA from:
"Time Series Background" Lecture 9/19/01
- Nonstationary
- Take 1st difference to return to ARMA
- Which is short range dependent
Argues that ARIMA(1,1,1)
can exhibit "LRD-like properties"
Is "Long Range Dependence" Real?
How to investigate?
Zooming Periodogram of 1st differences?
Recall from Lecture 10-15-01
1st Try: Zooming Periodogam on differences
- No "Long Range Dependence"
- I.e. no "pole at origin"
- But differencing "kills low frequency components"
-
What is expected?
Recall direct Zooming Periodogram
- Massive pole at 0
- So proceeded withe log-log analysis
-
And used "theoretical normalization"