Class Notes: Thursday
8/22/02
Classical Statistics:
Get "insights about data" from numerical summaries:
1. Mean: ![]()
2. Standard
Deviation: 
Potential Drawbacks:
- May only tell part of the story
-
Could be the wrong part
Example 1: Incomes data (from last meeting)
- Mean = 57,670
- Interesting "contradiction"
% of data smaller than mean is: 56
- Mean is "not data point in the middle"???
- "one in the middle" is called the "median" = 52,985
-
But then what insights come from the "mean"???
- Standard Deviation = 34,286
- "Usual interpetation": 95% of data is between mean +- 2 SDs
- Interesting Contradiction: mean - 2 SDs = -10901
but data are all positive!
-
Conclusion: usual SD insights don't work here
Question: what is going on here?
Simple View: Histogram
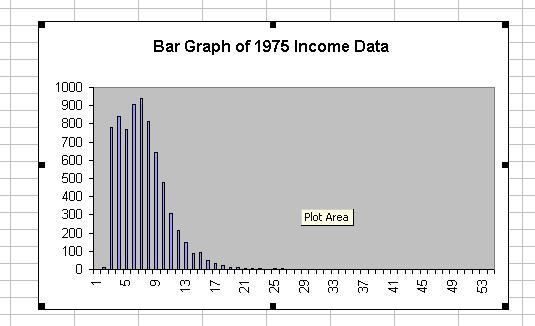
Data are "right skewed": meaning
- many small data points
- very few, but very large, big data points
- as expected for incomes
- Note: value in middle (median) is different from mean
- since data farther away have "more leverage" on the mean
- Note: graphic clarifies above "contradictions"
- Very deep question: what is "center"???
- Lesson: simple numerical summaries not enough (in general)
(will look much more deeply
at histograms later)
Example 2: Internet data (from last meeting), focus on "Response Sizes"
- Mean = 6,186
- Even crazier "contradiction"
Amount of data smaller than mean is: 83%
- Mean is very far from "data value in the middle"???
- "one in the middle" is called the "median" = 722
-
Again insights about the "mean" are slippery
- Standard Deviation = 344,928
- Much bigger than the mean?!?
- But all of the data are positive?!?
- Gross violation of usual s.d. intuition
- (good visualization will show again caused by "skewness")
-
Again Conclude: usual SD insights don't work here
Again: understanding of these problems is easy with visualization
(coming later for these data,
problem is data set too
big for Excel,
requires better software,
e.g. Matlab,
which will load next Tuesday)
There are many more numerical summaries
But all have the same general problem:
can miss important insights
Alternative approach (taken
here): look and see, i.e. "visualize"
Data Types:
Cleveland gives useful classification (his Chapters):
- Univariate (one dimensional): simple lists of numbers
- Bivariate (two dimensional): lists of paired numbers
- Trivariate (three dimensional): lists of triples
(note above only considered
the 1st of these 3 numbers)
- Hypervariate (higher dimensional): larger sets of related values
Following the text, we will
focus on univariate for a while
Back to Statistics
6D Home Page